InTDS ArchivebyMahyar Aboutalebi, Ph.D. 🎓Creating a Streamlit App for Satellite Imagery Visualization: A Step-by-Step GuideExplore any point on Earth at any time using satellite data with StreamlitJun 21, 20242Jun 21, 20242
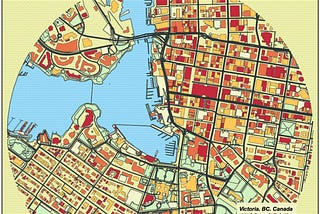
InLevel Up CodingbyJohn Loewen, PhDPretty Maps: A Surprisingly Useful Way To Better Your Streamlit SkillsA Python streamlit tutorial on creating beautiful maps with the prettymapp libraryMay 16, 20242May 16, 20242
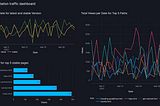
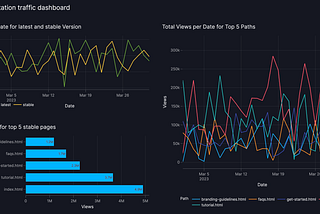
InTDS ArchivebyJo StichburyI Built a Reusable Dashboard for Read the Docs Traffic Analytics Using Vizro-AI(In less than 50 lines of code)May 17, 20241May 17, 20241
InTDS ArchivebyYouness MansarMeet the NiceGUI: Your Soon-to-be Favorite Python UI LibraryBuild custom web apps easily and quicklyApr 16, 20248Apr 16, 20248
InTDS ArchivebyDipanjan (DJ) SarkarThe Art of Effective Visualization of Multi-dimensional DataStrategies for Effective Data VisualizationJan 15, 201827Jan 15, 201827
InTDS ArchivebyLogan Kilpatrick6 Julia Frameworks to Create Desktop GUI’s 🖥 and Web Apps 🕸You could build beautiful apps purely in Julia.Jan 5, 20221Jan 5, 20221
Canopy ChartsIntroducing Canopy Charts: A Visual Editor for Dynamic ChartsSite: https://canopycharts.comAug 25, 2021Aug 25, 2021
AppMasterTOP 10 Mobile App UI Design Ideas in 2022 | AppMaster.ioIf the mobile app doesn’t correspond to the latest design trends, it will probably be out of users’ interest.Dec 1, 20212Dec 1, 20212
InSpatial Data SciencebyAbdishakurCreate Beautiful and Interactive Maps with this Amazing Drag & Drop Web toolEasy & flexible web maps with Datawrapper.Dec 7, 2021Dec 7, 2021
InPlotlybyJovan VeljanoskiHow to build a predictive maintenance application with Dash and VaexBuild a custom ML application tailored to your needsNov 4, 2021Nov 4, 2021
InPlotlybyPlotlyHow Dash transforms Next Generation Sequencing Quality Control📌 Learn more about Dash, Dash Bio, and Alignment Chart ➡️ watch the recorded webinar!Oct 27, 20211Oct 27, 20211
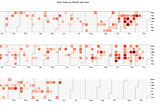
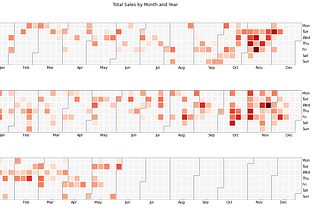
InAnalytics VidhyabyHARSHITA GARGCalendar Heatmaps : A perfect way to display your time-series quantitative dataA quick and simple guide to create calendar heatmaps using Python libraries and add interactivity using widgetsNov 20, 20211Nov 20, 20211